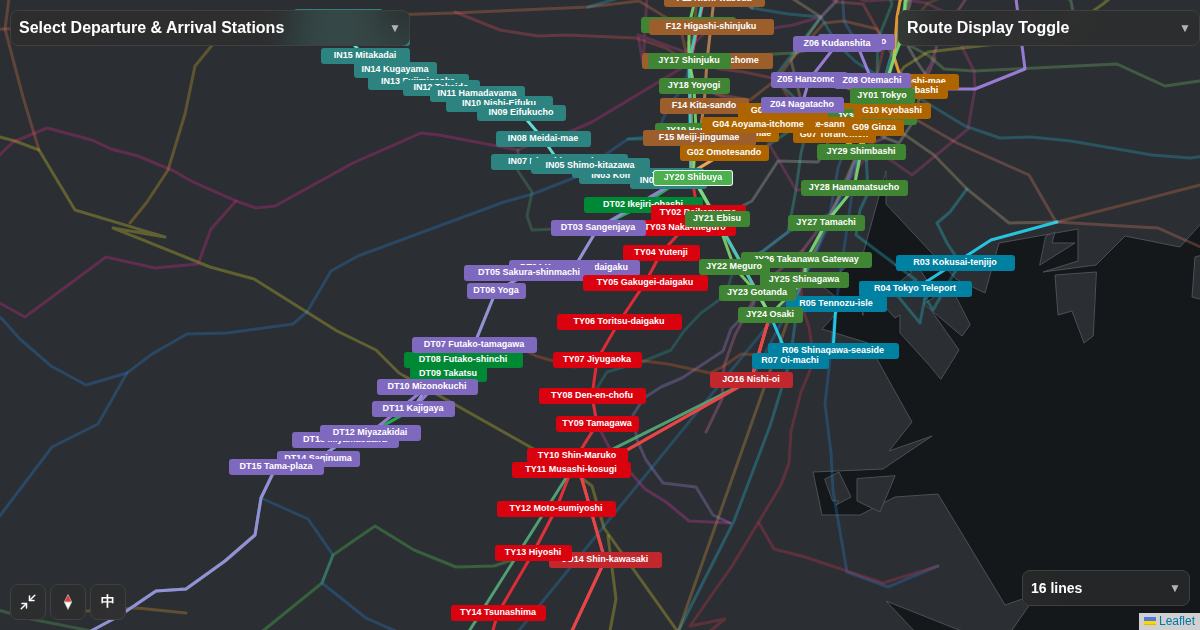
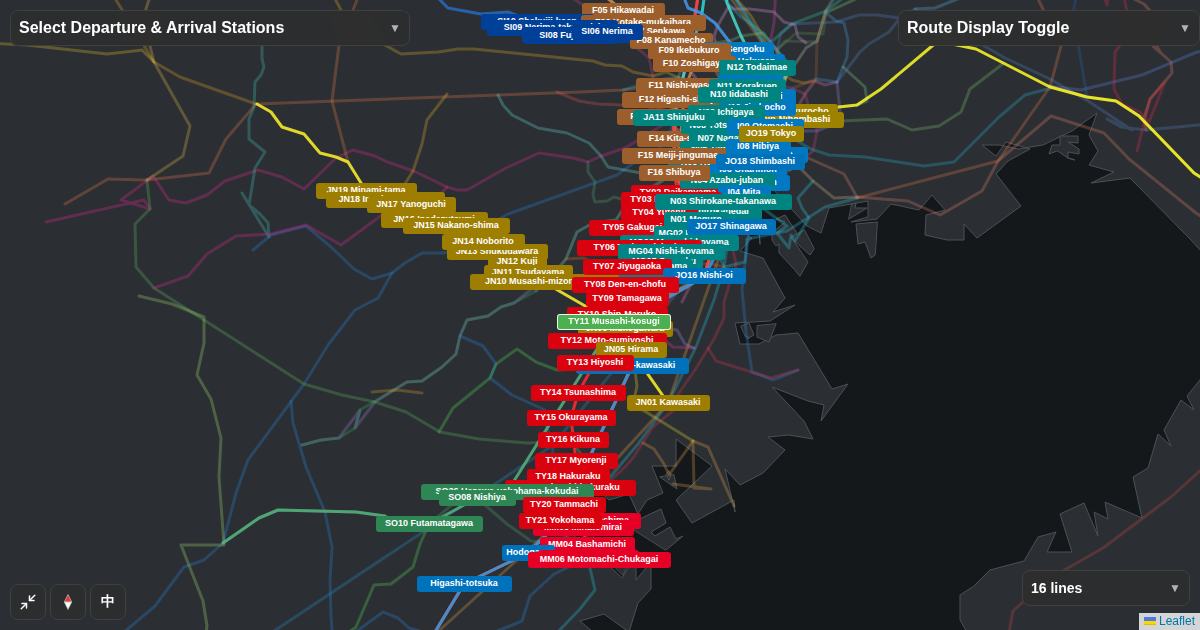
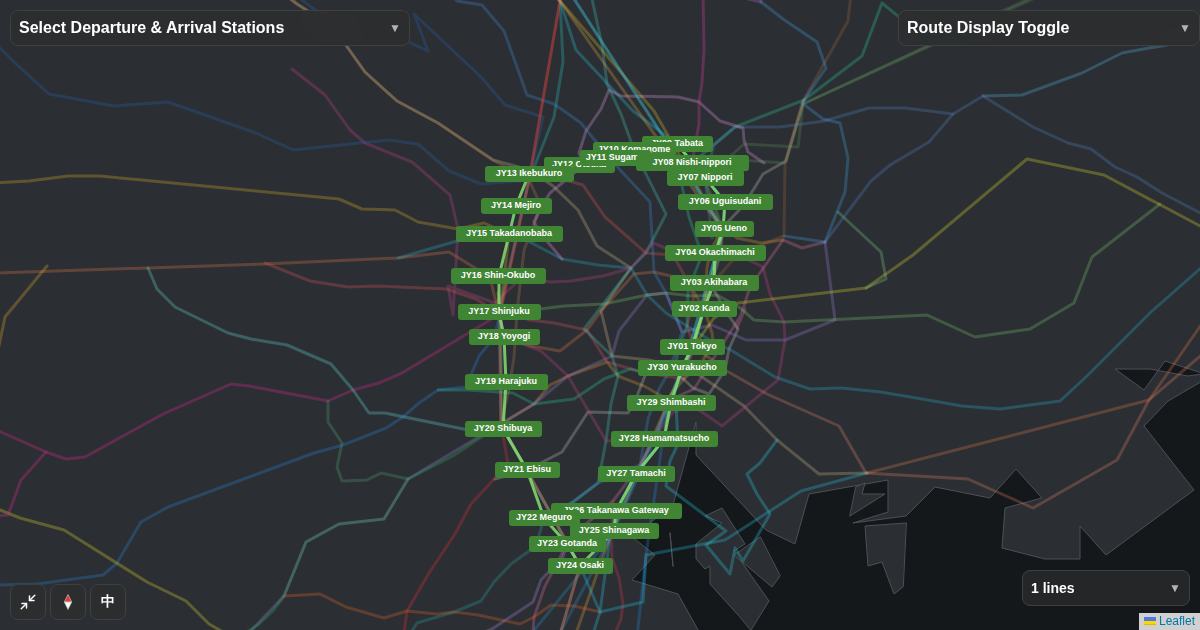
- Check public data per station and the area itself, not a line's image
- Crime counts in Flex Railway Map come from Tokyo Metropolitan Police block-level data (2023) and cover only 438 stations in Tokyo
- Counts are higher in busy commercial districts. Finally, walk from the station to your home yourself
01Do not judge a "safe line" by its image
Even on the same line, the surroundings differ by station, and at the same station by exit. Deciding by a line's reputation or a station name leaves out the streets you will walk every day. Check in this order: compare stations with public data, look at facilities around the station, then walk it.
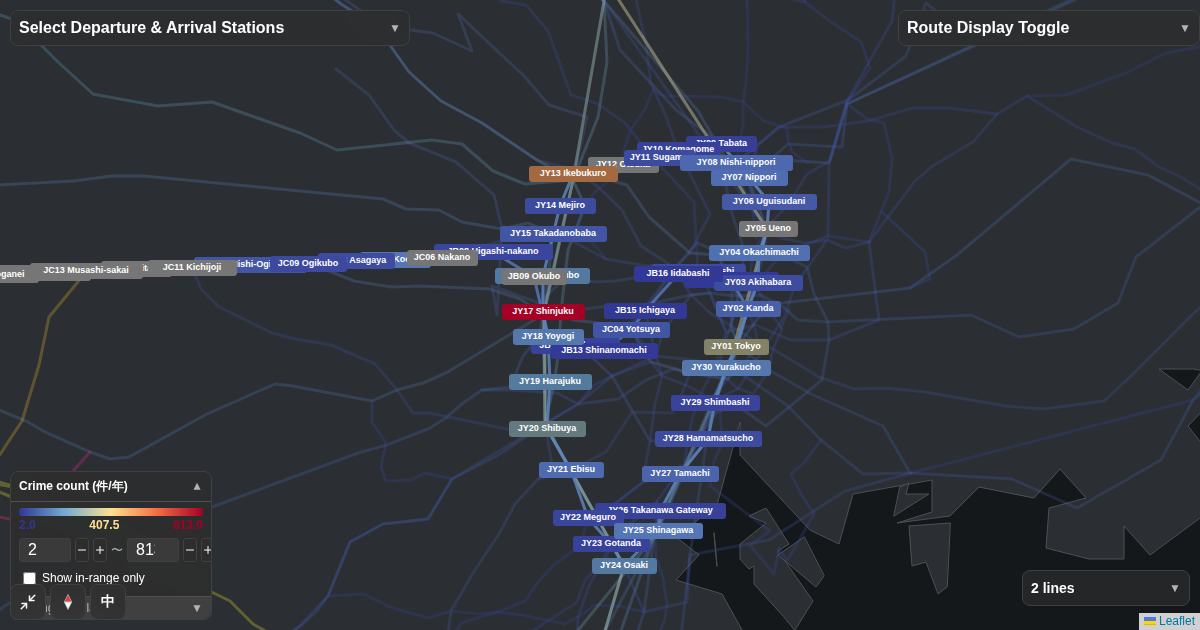
02See crime counts as colors on the map
In Flex Railway Map, choose "Crime count" under "Visualization" and stations are colored by count: bluer means fewer, redder means more. The source is the Tokyo Metropolitan Police Department's published crime counts by town block (2023), and each station is given the count of the block it stands in.
03A high count does not mean a bad place to live
Recorded crime counts are incidents in that place, not per resident. They rise in commercial districts where shoppers and commuters gather, and a quiet residential area can lie just a few minutes from a busy station front. Data exists only for 438 stations in Tokyo; other stations appear gray (no data).
On each station page, "Around the station" lists the count together with nearby facilities such as restaurants, supermarkets and parks, plus how and when each was counted. Judge livability by reading counts and facilities side by side.
04Finally, walk from the station to your home
- Walk from the gate and exit you will actually use to the property
- Look at street lights, sidewalks, sight lines and foot traffic
- Besides a daytime viewing, walk it once at the hour you would come home
- Check the building itself too: lighting in shared areas, auto-lock and so on
Neither data nor impressions guarantee safety. Use them to gather more information for your decision.
Open a map colored by crime count
The map opens with Yamanote and Chuo Line stations colored by crime count. Change lines to compare your candidate stations.
Open the map →